Investment Chart Kondratiev Wave

Investment Chart Kondratiev Wave

Monday, 30 July 2012

Some charts for optimists

1. Economic Surprise Induces are troughing
Source: Credit Suisse
2. Earnings pessimism is extreme
(Socgen chart)
(Credit Suisse): after trough normally equities rise on average 4% in the following month when earnings pessimism is as extreme as now..


Earnings pessimism often troughs when it is as negative as now.

Thursday, 26 July 2012

Slowing of growth in UK, Germany and US

A very bad number for UK growth in Q2, -0.8% because of the diamond jubilee of Elizabeth and the lower amount of days worked. The consensus hoped for -0.2%.
In Germany the IFO declined and then it is clear that GDP growth is slowing too.
The eurocoin indicator and many other indicators already signalled that economic growth in Europe was worse in Q2 than in Q1. Base effects for Q3 are bad too.
In the US it was not so much different this time. The Phillyfed coincident indicator by state showed there are now many more states with negative growth than in Q1. This means about 1% economic growth. We hope that things will go better from August on, but it looks like Q3 will be disappointing too, 2% or lower (we are near the point people are saying that 2% growth is not all something disappointing, but really quite nice)

Wednesday, 25 July 2012

High taxes like new Dutch Disease bad for equities (JP Morgan)

JP Morgan had a report (Impact of Tax Rates on Stock Market Returns) how bad it is when you raise taxes. So Obama remaining in power should mean S&P 500 -7 to -14% and Romney +7 to +14%. [PV: history learns that when a democratic president is re-elected that lead to a rise of 20% of the S&P on average] The authors of JP Morgan doesn’t seem to be friends of Obama.
There are reasonably strong relations between higher taxes and more progressive taxing and bad equity returns according to JPM .

If you hike taxes on incomes and makes the system more progressive you could end up like the Netherlands: -5% each year for the S&P.

The returns of the Netherlands could have been worse when the Dutch didn’t had such a favourable treatment of taxes for business (chart below).

At the moment the US scores average for income tax and bad for business taxes.

The results are not that convincing: one could say that the bad results are caused by geography: maybe the Euro crisis produces all the bad returns, not the tax system.
Still, the tax influence seems to be pretty big and then one could better invest in Chile and Poland

Monday, 23 July 2012

some good news of the last days

After all these disaster stories about Spain it is good to see that not everything is going in the wrong direction for  Spain: the big problem that Southern Europe is not competitive, is according this export and import chart of Spain diminishing.  
In more and more Chinese cities the house prices are rising again, in Bejing the fastest. The problems are far form over, houses are unaffordable for the average Chinese and inventories of unsold houses are still way too high. But still, the situation seems to be improving and that is logic when wages are rising 10% or more.

The US is becoming a bigger and bigger energy producer. Not only because of fracking of natural gas, but also because of refinery production.


The German housing market is becoming stronger and stronger. After the decline until 2006 you had a pretty normal four years of stabilisation and since 2010 prices are rising. That can last for a decade or more.


Central banks are going on with their attack on interest rates: South Africa -0.5% is the most recent lowering of interest rates. The FED wants to copy the Funding for Lending system of the Bank of England to get more credit growth.


On medical discoveries they are making progress. Gammagard of Baxter International, is showing to retard the Alzheimer process with three years in a small trial. There are new pills against obesitas that will reduce weight 7% pretty easily.


There are now too many bears according to AAII. In the past years a rise of the S&P was then not far away. There will be hope the pain of Spain will diminish when Mario will be in a good mood.


Friday, 20 July 2012

Seasonals and calendar effects: Swinkels and van Vliet

A nice, thorough study by Laurens Swinkels and Pim van Vliet (July 2011): An anatomy of calendar effects (http://papers.ssrn.com/sol3/papers.cfm?abstract_id=1593770) (hat tip Lukas Daalder) shows there are only two effects really important:


1. Halloween effect (sell in May and go away but remember to come back in September (a bit adjusted): be invested only in the after Halloween period from November 1 to the witches sabbath of April 30 and

2. the end of the month effect TOM (at the last and first day of the month returns are higher).

All other calendar effects studied like several holidays, the January- effect, weekends etc were not strong enough to get really significant results.

Of course they could have studied a lot more things, like St. Patricks Day and especially FOMC days (these are the true holidays for investors). Also the first week of a quarter is often favourable for equities.


When you try to measure those effects you must correct for a lot of double counting, many holidays are in the Halloween zone, also January and when you correct for Halloween+ end of month nothing significant remains.

Trading at the end/ first day of the month that is not something that will make administrators happy and they will prevent institutional investors to exploit TOM, especially around January 1. That could be a reason for the surprisingly strong results of TOM.

When you are in the market outside the Halloween and TOM periods it seems you cannot expect positive returns for equities when you extrapolates the results from 1963-2011. Even when you try to be clever by investing in value stocks or small caps that will not help to get positive results in those disaster periods (large caps are safer, but still not winning). 


Warning: the studied effects are anomalies and these have often the bad property to vanish suddenly because they are arbitraged away. Not that long ago the January-effect was documented to be by far the strongest positive calendar effect and now it is only believed a bit for small stocks: the now profitable strategies are anomalies and they can suddenly stop to occur. Not that long ago the January effect was seen as the strongest calendar effect, especially for small caps (that small cap thing seems to be still all right).

Thursday, 19 July 2012

American dream (2): belief in free markets succumbs to bad times

The American Dream is the belief you can become rich when you work hard enough and that is mainly because the free market economy enables that. Pictures at night of North and South Korea show a big difference in wealth: without free markets it is difficult to get rich. In our theory of long waves the spirit of the age has to enable that the most important domains of freedom, care and justice are up to date good enough to cause better times. In some periods freedom is more important (like we saw in the past two decades), in some others justice and care (1965-1980 for example).


According to the table of PEW Center (via NYT: http://economix.blogs.nytimes.com/2012/07/13/chinese-love-free-markets-as-much-as-americans-do/ by Catherine Rampell) the Chinese and Brazilians are now the strongest believers in free markets, even more than Americans. The Ameriican Dream is exported to the BRIC’s, but Russia is moving away from it, just like in most other western countries where things are not going well. The belief in free market tanks when confidence in growth succumbs. Only Mexico is an exception, drug violence is asking for more justice, law and order and so free markets are not that popular even while economic growth is quite good


Tuesday, 17 July 2012

American dream (1): you will earn more than your parents, but will you be richer?

According to our theories of the Kondratieff wave it is important that you will see better times for the middleclass to get prosperity, to get a rising tide of the long wave. Because of the ICT Revolution, especially the Communication revolution with its big networks, you saw a part of the population, individuals (or cosmopolitans) doing very well, not only in the West but especially also in emerging Markets. The world becomes flat (Friedman), but is that causing a richer middleclass in Emerging Markets and a poorer middleclass in the West?


Until now it was one of the axioms of economic theory that high growth in a part of the world is good for growth elsewhere (the rising tide lift all boats). But maybe the middleclass in Europe and US is now not profiting from the rise of China, or profiting much less than the US did from the high growth in Europe after WWII.
Are trends in that direction already visible? The view on that is blurred by the credit crisis. Let us first think about the trend in the last years. In this first article I will concentrate on the US.

In the New York Times were a few articles as a kind of update for the American dream: how do the current children it compared to their parents in income and wealth. ( http://economix.blogs.nytimes.com/2012/07/11/only-half-of-americans-exceed-parents-wealth/ Only Half of Americans Exceed Parents’ Wealth by Catharine Rampell).
Her main conclusion based on the elaborate interviews by PEW Center since 1968 mainly based for parents on the 1984 wealth polls and for the children on three reports after 2000. Everything was corrected for age, in real terms etc. :

1. In almost all households in the US (84%) the children earned more money (in real terms) than their parents did at the same age.
2. About half of the households are now after inflation not richer than their parents were
3. When your parents didn’t earn much, the probability is quite low you will earn a lot (in the highest quintile) and the other way around: when your parents earned a lot the probability you will earn almost nothing (lowest quintile) is low.
4. The re is a lot of income mobility in the quintiles: the probability as a child to get a better income than your parents was considerable.

Thursday, 12 July 2012

Credit growth of Turkey, Russia and Indonesia dwarf China's

Drought sends corn price to extremes. El NiƱo?

Record amounts of corn were planted in the US. It was so much that Monsanto had to give a revenue warning that it seeds were selling much more than thought. So corn prices went down. Then drought arrived as was expected by some that thought el niƱo would arrive. This seems to happen and now UK/Europe is extremely wet and the US until At least August extremely dry. They started to say it was dry and then it was changed to worse and worse expressions of drought. Now it is near the Dust Belt analogy like in the 30's (not yet completely as bad).

So harvest expectations are going down. In thick black lines you can see the important corn states. So to see not all states are heavily hit, so maybe it is not as bad as everybody is saying.
In India the drought is maybe even worse. MAybe this is also caused by something like el niƱo. When this should continue it will hit GDP growth at a moment that growth is already weak.

Wednesday, 11 July 2012

Royal Dutch Shell 1 in Fortune 500

As Dutchman I'm proud Royal Dutch Shell is 1. It was already quite some years ago, but Royal Dutch Shell is again the revenues leader in the Fortune 500. China and Korea are getting more important, but not as important as Japan around 1990.

Friday, 6 July 2012

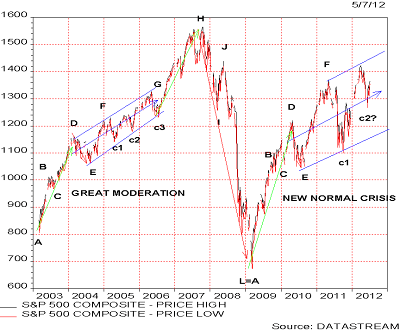
Update four year cycle

Ter Veer and I used our four year cycle method with 10 phases for decades and often it supported the views on equities very well. It is of course not infallible and other methods are more popular today (often you see Hurst-like cycles of 54 months for example, those methods usually point to hell in coming quarters).


There are four base periods: the fast rise at the start, the first correction in the slower rising phase and the last fast rising phase leading to the high of the cycle, after which a decline, first slowly, later fast normally will develop.

According to us we still seem now to be in the phase FG. The range is quite wide because we are no longer in the period of the Great Moderation, but in the much more volatile period after the credit crisis with some kind of a New Normal. FG has lasted now quite long, so the next phase could start soon. The phase FG, in which economy grows about according to trend can last very long, especially after a Juglar decline before the start of the cycle. So a third correction is very well possible. FG has lasted long enough, so c2 could maybe signal the start of the phase GH. GH is a phase of fast rising prices. It ends at the top of the four year cycle, it looks like at an all time high for the S&P after which a material decline should follow in 2013.

It looks improbable to almost everybody that we are moving to a fast rising phase in the four year cycle, but maybe it is just because it is so difficult to imagine with all current fears about Europe and government bond yields signalling stagnation forever. When there is no recession in the US expected profits will continue to rise while PE’s are very low. Excessive liquidity from central banks could easily trigger higher confidence and so PE’s, maybe Europe is not totally lost, only a bit. So I would not disregard the possibility of a good equity market in the coming year.

Thursday, 5 July 2012

update juglar cycle (US)

In the chart above you see the annualised contribution of the fixed investments to growth of the GDP. From time to time this is negative and the Juglar has gone down then. The blue vertical lines give the troughs of the Juglar cycles (there was a double dip 1980-1982). Since 1980 we have seen four troughs. A Juglar ought to last 7 to 12 years. The last trough was in 2009, so the next one should not arrive before 2016, more normal somewhere around 2018-2020.


The tops are charted with the highs in the capacity utilisation (green vertical lines). The highs became lower and lower since 1980. In 2007 the high was very low. We have to hope that the high of the current cycle will not be lower again, but a more normal 84-86.

In Europe we are marching to a new low in the Juglar, way too early. Maybe I’m wrong and will the investments continue to grow (profits are good enough). The euro crisis with its impossible financing of investments sends the Juglar down premature in many European countries.


Wednesday, 4 July 2012

The world gets less black: buy

The chart above was yesterday very popular to show too many people are bearish. That could be very well true.
The S&P has not reacted favourably enough on the accelerating credit growth in the US (despite the four big banks where credits declines, so the smaller banks are clearly giving credits) (chart of Bianco).


The help from lower oil prices to the real retail sales (especialy cars of course) and so to the initial claims seems underappreciated.

The comments of Morgan Stanley that the Euro crisis is getting less black is very positive for risk on. It is strange they say it is not a tradable rally because problems are not over, it is still black. Minack should know better: when it gets less black it is bullish. So don’t say it gets less black unless you are becoming bullish or less bearish. Now he is only describing how big the wall of worry is.

Tuesday, 3 July 2012

ISM falls more than expected

At 49.7 the ISM was lower than the consensus (52) thought. The regional ISM’s in the US had already indicated that ISM should come in below 51. That was already clearly below my model for the trend of the ISM, even when you took the lower PMI’s of China into account. 49.7 was a nasty surprise.


Especially new orders (inclusing exports) were disappointingly down: from a good 60.1 to a bad 47.8. Employment remained good at 56.6 (last month 56.9). ISM told the decline was mainly caused by uncertainty about growth in Europe and China (that is not in my little model).

When the ISM should remain at current levels economic growth in the US will be c. 1-1.5%. before the credit crisis this was higher. A recession could start at ISM’s below 47 (before 2008: below 43).

For the next months the ISM is expected to rise because real retail sales will be better because of lower oil prices, also initial claims will be lower because of this.

In Europe the ISM’s were even lower. They are now that low a further decline will not be big, this could be the bottom.

Barron’s lead article: [China a] Fallen star

The most important arguments for their doom & gloom:


1. The brut state debt if well consolidated is not 50% but 150% of GDP (but then you own all infrastructure, subsidiary loans for banks etc). 150% is already a lot, but it is rising fast.

2. The banks are weak with much more bad debt than you think [PV: that is an old problem: banks in China had always way too much debts of weak state loss making companies, but the last two decades these bad debts have become way smaller as part of their balance sheet and the capital of the banks has grown impressively, so banks are now healthier than in the past (but that health will vanish when growth in China falls too much for too long).

When the Yuan remains weak for longer the banks can be troubled with a liquidity problem when foreigners/ rich Chinese no longer al their Money want to keep in Yuans, because their very strong belief in a strong Yuan (upward only) becomes unbelievable [PV: this can become a problem, but banks are still very profitable in China (53% of all profits in China)

The chart above from WSJ shows the sudden rise of the preference for dollars instead of Yuans.].


3. The demography is weak. After 2015 the cohort 15-24-year will become small. There are 120 boys against 100 girls and that will trigger criminality and frustration.

4. Investments as % of GDP are way too big, much bigger than Japan/ Singapore/Korea at the comparable point of development. In a command economy this capital will not be used effectively. Just like the high growth numbers of the Sovjet Union in the fifties and sixties this will lead to too low true growth of consumption.

5. There is too much income inequality. Corrupt leaders will get too much rewards and that will go wrong at some point. When Xi Jin Ping doesn’t end this soon (somewhat more), China will become a chaos. The elimination of Bo Xilai is a sign Xi will attack corruption.


All in all the slowing of growth in China is quite clear according to me. For the time being growth can be manipulated to c. 7.5% with infrastructure investments and more credits to non state companies (so squeezed in 2011).

Over some years (2018-2020?) growth will be a problem because more infrastructure investments are no longer helping enough (multiplier is declining). Investments going back as % of GDP was a big problem in Japan after 1990, but because China is still much poorer than Japan in 1990 and human capital is rising strongly with better education etc economic growth can be 6% on average afterwards (not bad for a country with a non growing population) .