Investment Chart Kondratiev Wave

Investment Chart Kondratiev Wave

Wednesday 8 August 2012

Update Kondratieff Wave

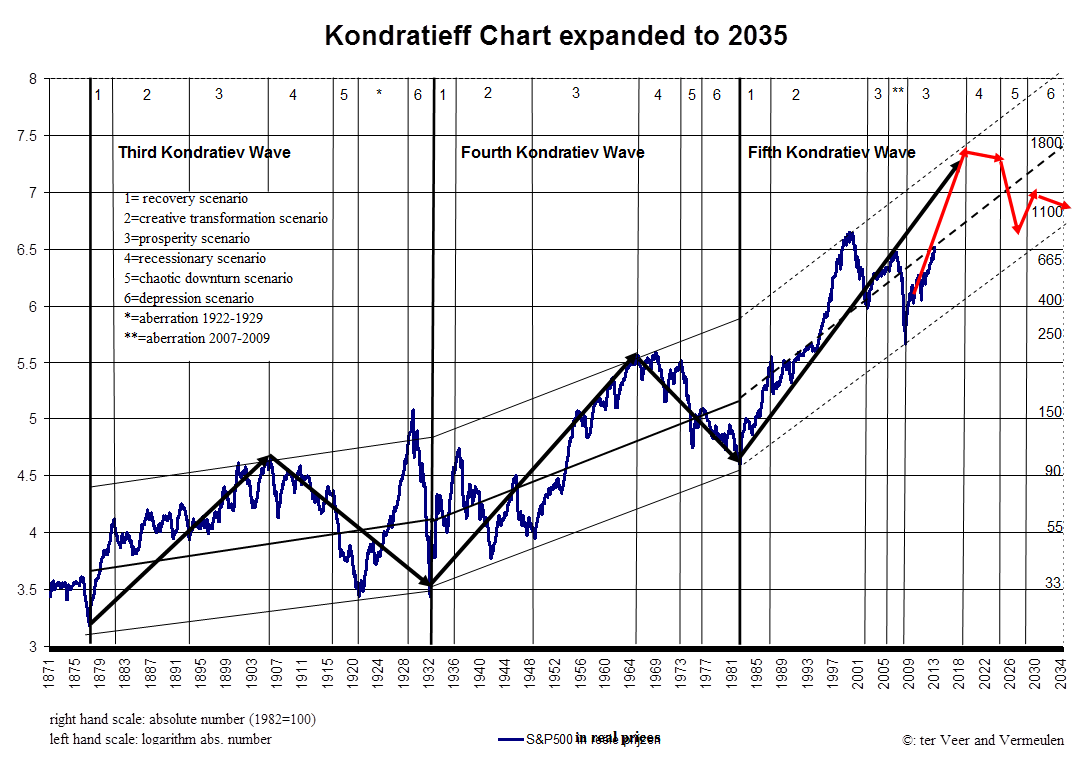
Optimistic chart of the S&P500 corrected for inflation on a logarithmic scale (as above in the blog). Since December 2009 (publication of the book with current chart and red arrows) the S&P has followed the trend of the red arrow pretty well, even while the S&P was more often below the red arrow than above (explanation with the four year cycle: until the last upward phase GH arrives the S&P ought to remain a bit below or at the red arrow).
Pessimistic chart of S&P500, with other time scale for the six scenario’s. This is the explanation of the believers in the winter of the Kondratieff wave.

We are pretty near the point where you have to change to a less pessimistic version of the pessimistic chart of the Kondratieff winter.
Even when the optimistic chart should prove to be right it still can last some time before the winter will be expelled. A new correction (the last years happening so often) will revive the belief in the winter.

 
Above JP Morgans ‘thoughts about the long wave (logarithmic scale but not corrected for inflation). Every 15 to 20 years a new bull market started. The next chart can be some time away because we are now only at the line through the highs of 1906 and 1965.

They give three periods in which equity markets didn’t rise for a long period. What were the main reasons for the bad performance of equities?

1906-1924 correction of high valuations, war, Spanish flu, stagnation of profit growth

1937-1949 austerity government spending/ extreme expansion of government, war, inflation

1966-1982 correction of high valuations, wages rising faster than productivity, inflation, oil crises

2000-2009/12 correction of high valuations, debt crisis, extreme expansion government spending


More in general:

• In every case there was a correction of the valuation of equities (after they had become too expensive)

• There was disappointment that things were not going as good as thought

• There were severe shocks that caused a crash of confidence for a sustained period

• Government took too much of the GDP and the forced austerity afterwards caused slow growth before and after austerity

There is a lot of doubt about the growth of the structural trend. According to most commentators of JPM’s chart the slope should be slower, around zero for the future. Ter Veer and I see the opposite: the trend is going up faster because of high growth in the world (Emerging Markets grow very fast and dominate growth in the world, China alone will soon be bigger than Western Europe in total) and because of structurally higher productivity growth (especially in Emerging Markets and the US) since 1995 because of the ICT Revolution (current application phase shows highest productivity growth). Profit growth will be good in the coming decade because business is more powerful than employees.
Monday 6 August 2012

Good news of the last week

1. The hope rally of surplus liquidity
The most important last week was the analysis that with some patience one should have to get more glad and hopeful with the plans of central banks in the world.


The FED and ECB didn’t give instant gratification last week, but the analysises afterwards and afterwards became more positive by the day. In September it will be very likely that the FED will act. At the end of August on the congress of the central banks in Jackson Hole Bernanke and Draghi will compete who will give the most and best unconventional new means to battle pessimism and provide more liquidity (e.g. with the British Funding for Lending System). Something else is also allowed to get lower interest rates in Southern Europe without Germany becoming too angry.

The ECB opened the discussion for quantitative easing/ buying PIGS bonds in the future and only Germany objected.

[ “Over the coming weeks, we will design the appropriate modalities for such policy measures”. According to the head of the Bank of Finland (who made remarks Friday), the ECB will take control and cool market turmoil once preparations are over. “Once preparations are over, we are ready to act” (Bloomberg).]

The market seems to believe in the plans of Draghi, because the yield curve steepened considerably.

2. Economic Surprises less disappointing


Almost as much hope produced the further recovery of the Citigroup Economic Surprise Index. Some analysts even produced a buy advice for cyclicals base don this (and for the ones with a strong heart: in the previous rounds of QE automobiles & parts went up the most). Quantitative Easing is only amplifying economic trends, without those going up QE is not enough to push up markets.


3. China wants higher equity markets

In China they are following the strategy of the FED to talk up the markets when they declined too much. Lowering interest rates is not enoug. The Chinese government suddenly communicated that Chinese equities were too cheap. It was a shame they have declined 52% from top while in the same period nominal GDP almost doubled. So they lowered transaction caists and suggested business to give equities to their workers.

4. better real personal income growth and so soon also retail sales
In the US not only the housing market is improving, the mini cycle also seems to have troughed (that is why economic surprises became less negative)

Wednesday 1 August 2012

Pessimism about growth extrapolated: age of diminished expectations (Minack, Strategas, Pimco)


George Minack of Morgan Stanley as usual had nice charts with the accompanying gloomy and dreary analysis. How things are going in the US is just disappointing, see chart above.

Economists usually start forecasting something like trend growth, but nowadays that seems more 2% than 3% (=law of Okun). In the last months the expectations for 2013 got down seriously (because of bad recent numbers and fiscal cliff) and also 2014 starts to deviate from Okun’s 3%. Austerity will bring down growth to below potential in the US like in 2011 and 2012 and fiscal austerity will be the New Normal.


Accordingly the expected profits for the coming years are going down seriously. That revision still has more to go according to Minack. In the US the PE is still about the same as in last year (mainly because of miraculously good macro expectations), while in other countries the PE has gone down materially already. So American equities are very expensive, way overvalued for believers in Shillers (Graham)s PE.


So forget about good returns of equities: profits are gong down and PE’s also = bear market.


Then the growth in the Euro-Zone, that is not disappointing, but very, very disappointing. It is a miracle European equities still have some value.


Strategas had the chart above as proof that PE’s have to go down in the coming years.


I have to say that this analysis is believed by many more people than my analyses about a brighter future ahead, mainly for not that important (in western eyes) countries like China and India. People like to extrapolate trends. The charts above are pre-eminently suited for this. I think that has happened in the heads of most investors and so it should be discounted now in the prices.


Even as people have seen in Australia interest rates in the Netherlands are at their lowest levels in 500 years. Ineterst rates are becoming negative in more and more countries for longer and longer durations. But maybe it is no longer that safe to extrapolate the trend.


Pimco mentions now the end of the cult of equities. People have to become sensible and forget about equities (and in the future they should only invest in bond funds of Pimco).


You never know but maybe in the next years equity markets and bond yields will rise materially. Maybe they continue the path of the Kondratiev wave as lined out above in my blog.

Is it like 1937 or like 1949? The time of diminished expectations

Many people fear that after the fiscal cliff of 2013 the US is in the same situation as in 1937. After the tremendous Roosevelt government stimulus from 1933-1936 came the bill and that austerity caused below trend growth from 1937-1942 including a big recession. Also it originated inflation after the deflation period. World War II made an end to the bad period, but only after 1949 growth really came back.


It is at least as likely that you can compare the current situation 2000-2012 with 1937-1949.

In 2000 it was not government spending that had to go back, but business spending that had been way too high from 1996-2000. After 2000 you got artificial economic growth, not from a world war, but from the housing market used as ATM. The bill came in 2007 and the damage was big but unlike 1937 there were some positive developments in the world: the emerging markets, especially China, helping the world economy and the ICT Revolution helping productivity growth. Also monetary policy was better than after 1929.

In 2010 new problems arose in Europe. This was a bit comparable with 1946 when many of those no longer necessary soldiers didn’t do productive work as was hoped for. Europe was weak and its currencies were not trustworthy, only the US Dollar was a safe investment (like 2012). Interest rates in the US set a record low in 1946 and remained very low until c. 1953.

In 1949 people looked back and concluded a man sound of soul and mind should no longer invest in equities. Since 1929 dividends had not been rising and prices and dividends were very volatile, so safe US government bonds delivering 1-2% were the preferred investments. The Fed had promised to keep the FED rate very low for an extended period. US government debt was far above 100% of GDP. German bonds and equities were of course way too dangerous and interest rates were rightfully much higher than in the US.

So this all sound familiar. The case for 1949 is equally interesting as the case it is now 1937.

In 1953 suddenly all the pessimism was thrown away: a strong belief arose that dividends were structurally growing and that dividend yields should be below the government bond yield. This belief continued until 2008, then the opposite was thought again like in 1949. Like in 1949 people think now that it is unclear that dividends will grow and looking back… one should better not do so…

To keep it comparable with 1949 there must arrive something that causes higher economic growth than in the previous decades and uncertainty has to go down.

That something ought to be: things have to be better than thought now and for in a few year believable reasons. It is not so difficult to see what that should be: continuing growth in Emerging Markets making them an excellent market for exports and cheap imports (like after 1949 Europe was the Emerging Market from the ashes of WWII), a believable plan to get growth back in Europe (ECB/ESM financing enough, infrastructure building etc), like the Marshal Plan and a wave of innovations like after 1949 (because of WWII a lot of innovations were stalled and they exploded after 1949). That wave of innovations is already visible in the growing force of the ICT Revolution with its internet networks of tremendous force and knowledge (never in history grew Knowledge so fast as in the past decade).


All in all, I think it is more like 1949 than 1937 now.